Inventory reports
What your stock is worth, what it cost you, what moves and what doesn't, what is lost, and what expires.
- Who can do this
- Manager Owner
- Permission needed
- «View Reports»
Reports → the reports after Shift History:
| Report | Answers |
|---|---|
| Stock Valuation | What the stock is worth now, by category |
| COGS & Profit | What the goods you sold cost you, and the margin on each product |
| Inventory Turnover | How fast each item sells — fast, normal, slow |
| Dead Stock | Items that have not sold for a number of days |
| Batch & Expiry | Every lot with its expiry: valid, expiring soon, expired |
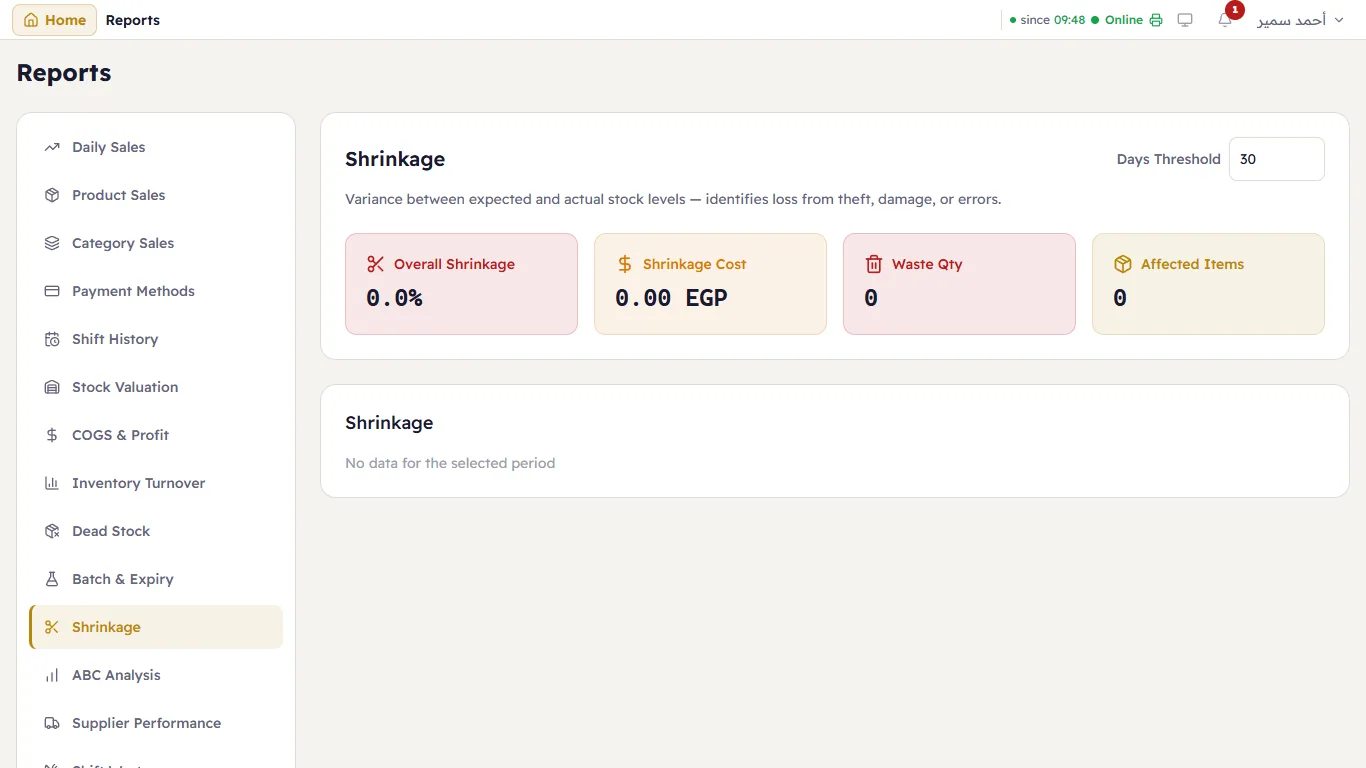
| Shrinkage | The gap between expected and counted stock — theft, damage, mistakes |
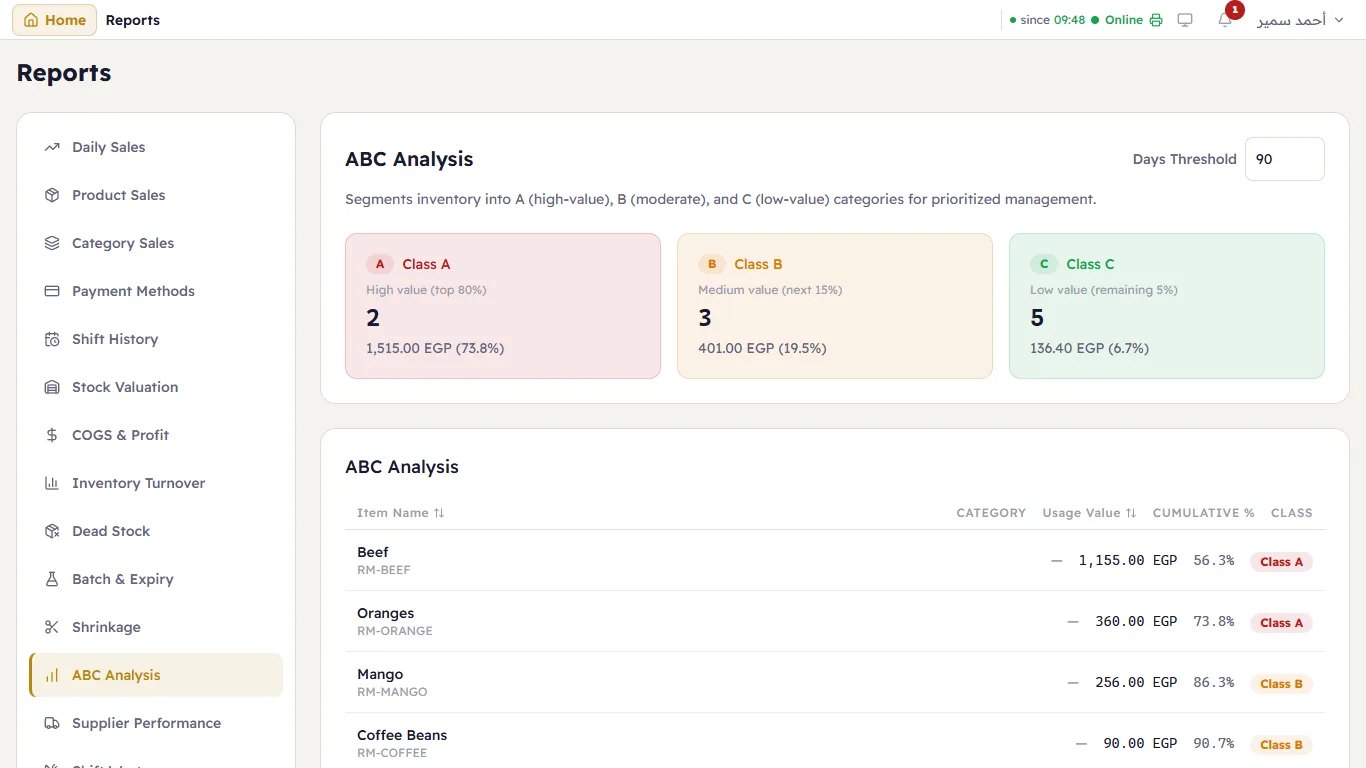
| ABC Analysis | The few items (A) that make most of your value, and the many that make little (C) |
| Supplier Performance | Delivery time and how completely each supplier fills your orders |
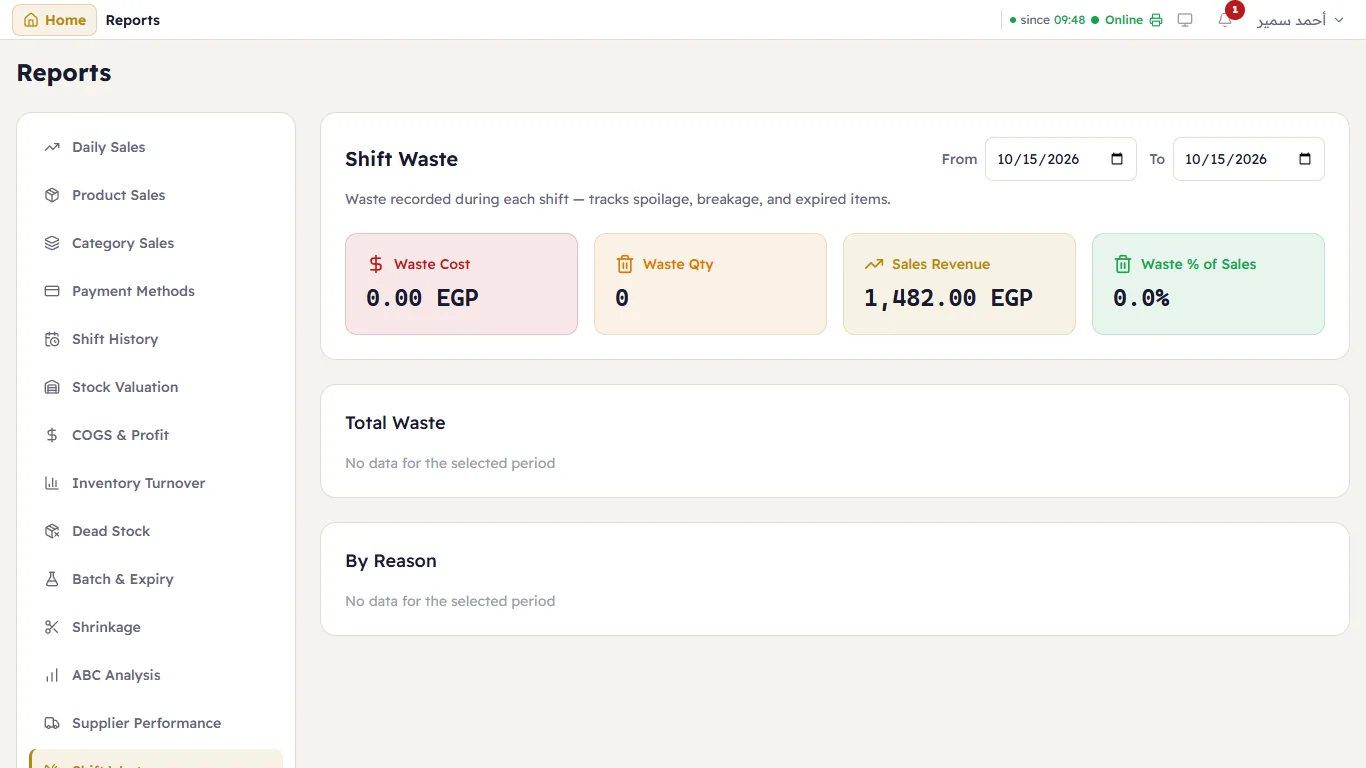
| Shift Waste | Waste recorded during a shift |
| Production Plan | The ingredients a planned production needs (kitchens) |
Stock Valuation
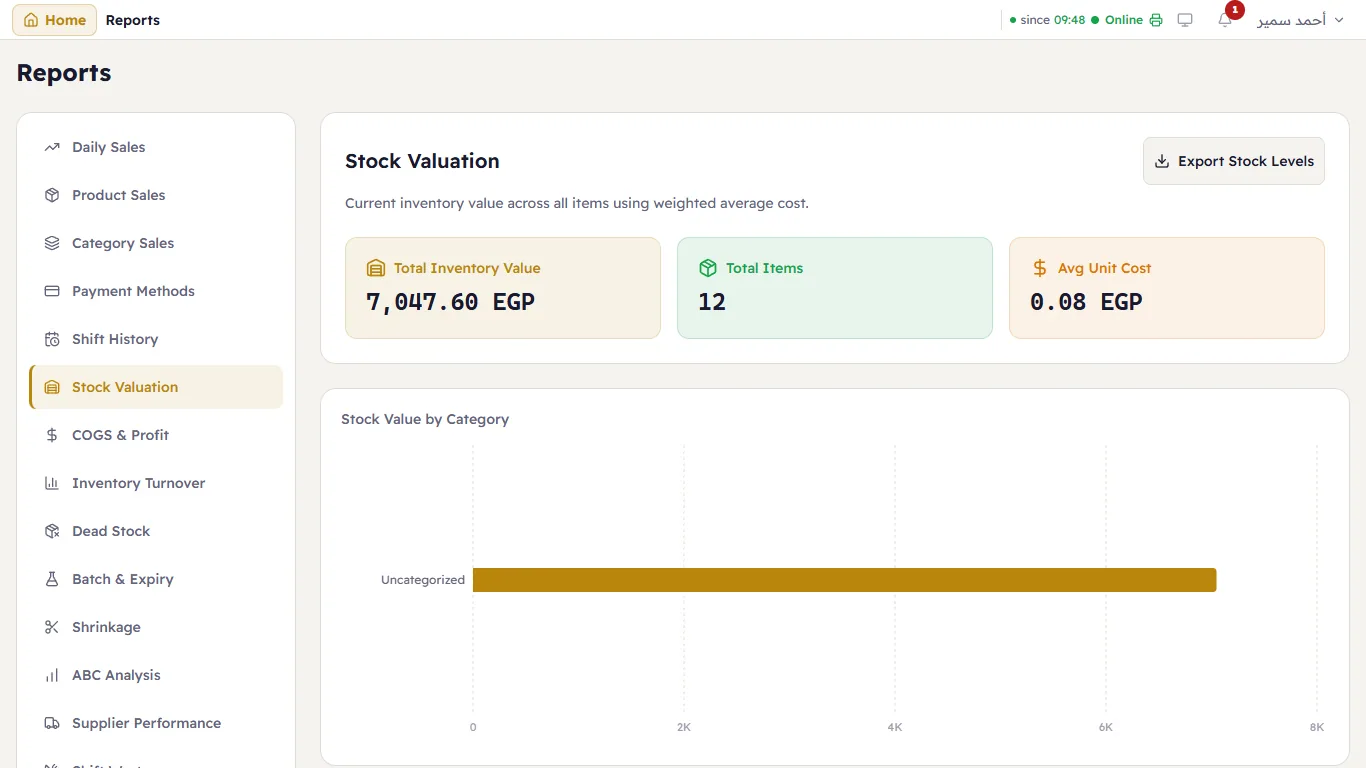
The Total Inventory Value, the number of items, the average unit cost, and the value of each category.
COGS & Profit
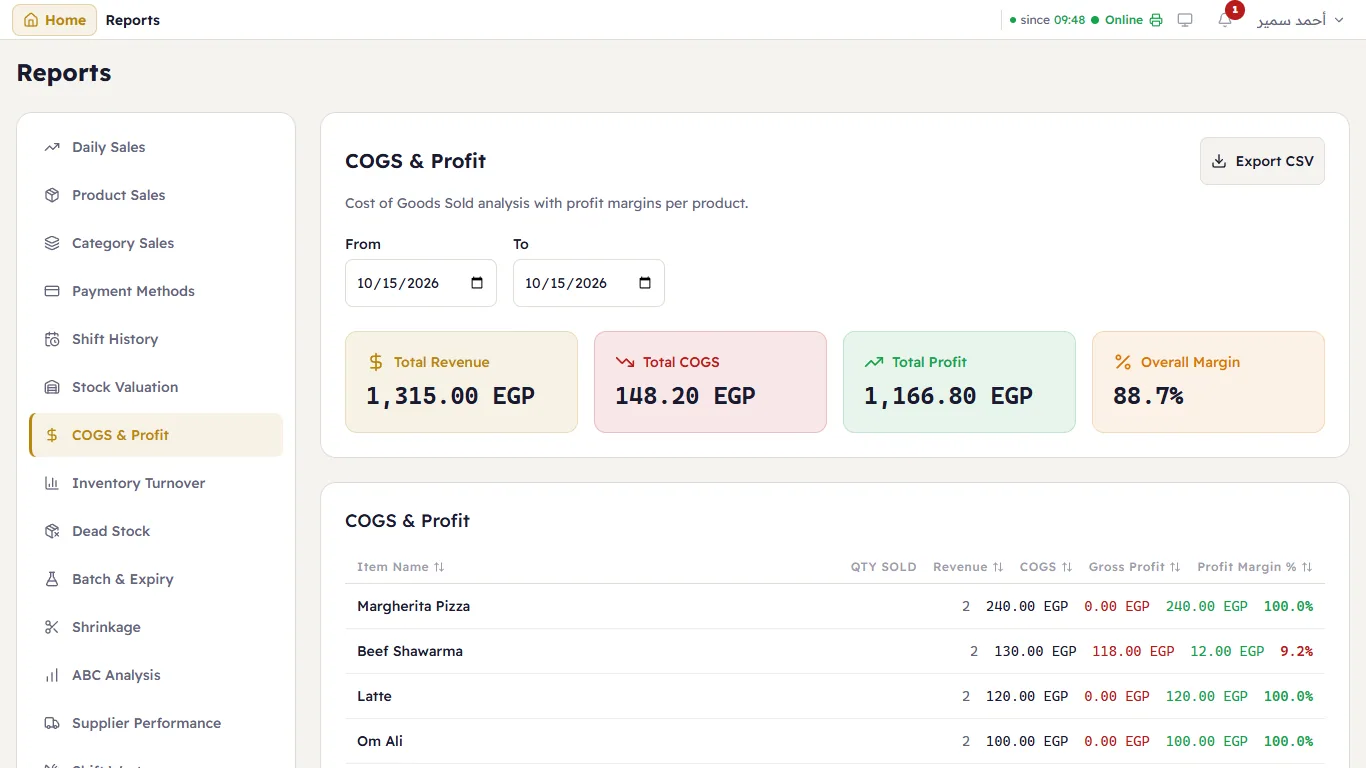
For the period: revenue, the cost of what was sold, gross profit and the margin %, then each product. A product sold without a recipe or a linked item has no cost, so it shows 100% margin — give it a recipe.
Inventory Turnover and Dead Stock
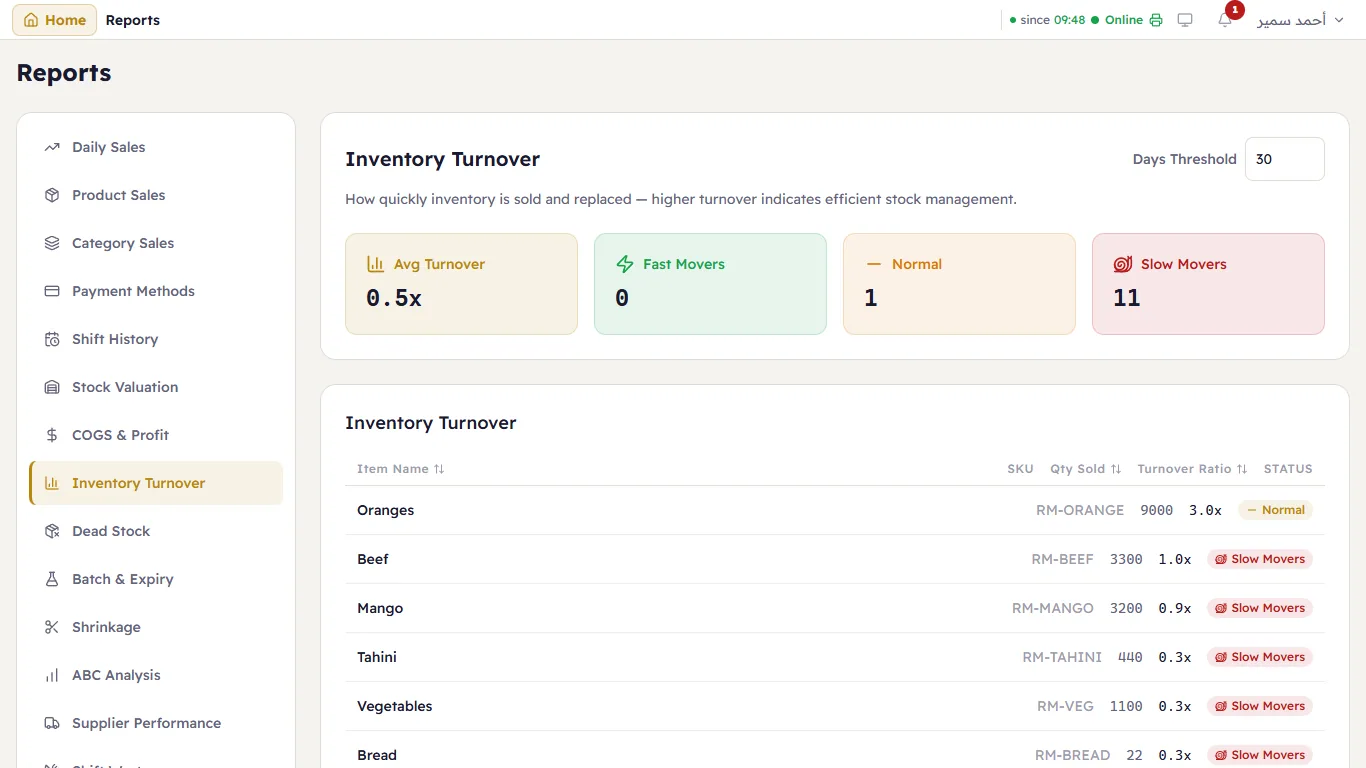
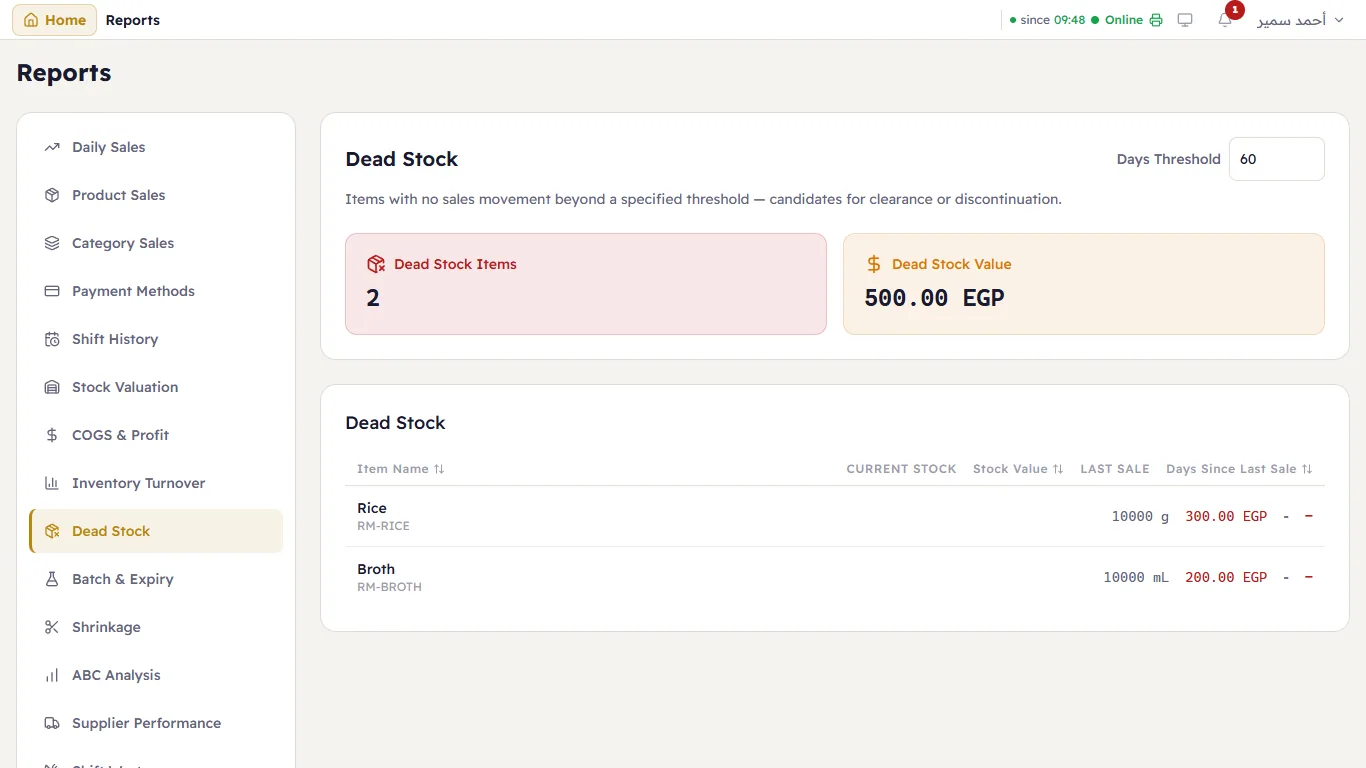
Both take a number of days. Turnover classes each item fast, normal or slow; Dead Stock lists what has not sold in that time and what it ties up.
Shrinkage, ABC, Shift Waste
Production Plan
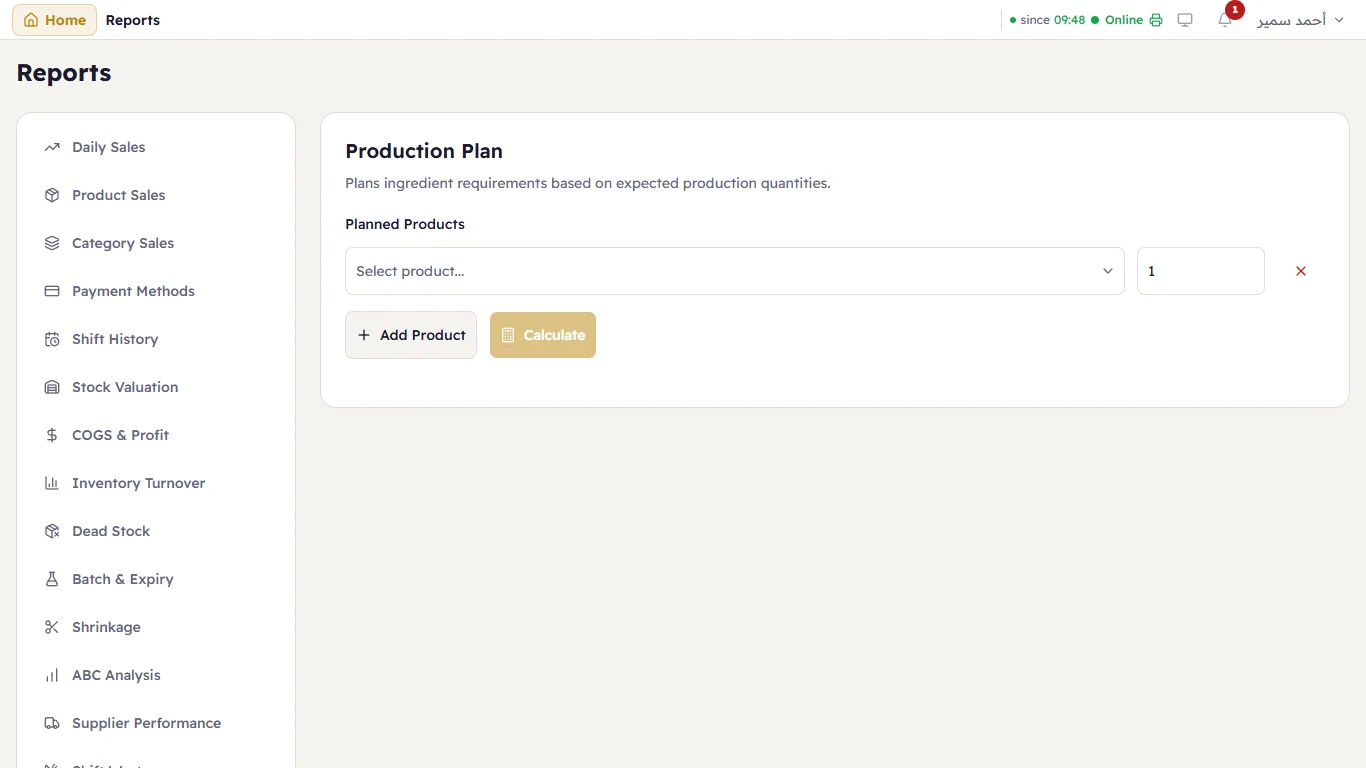
Choose the products and how many you plan to make, press Calculate, and Major lists the ingredients needed against what you have.
Batch & Expiry and Supplier Performance
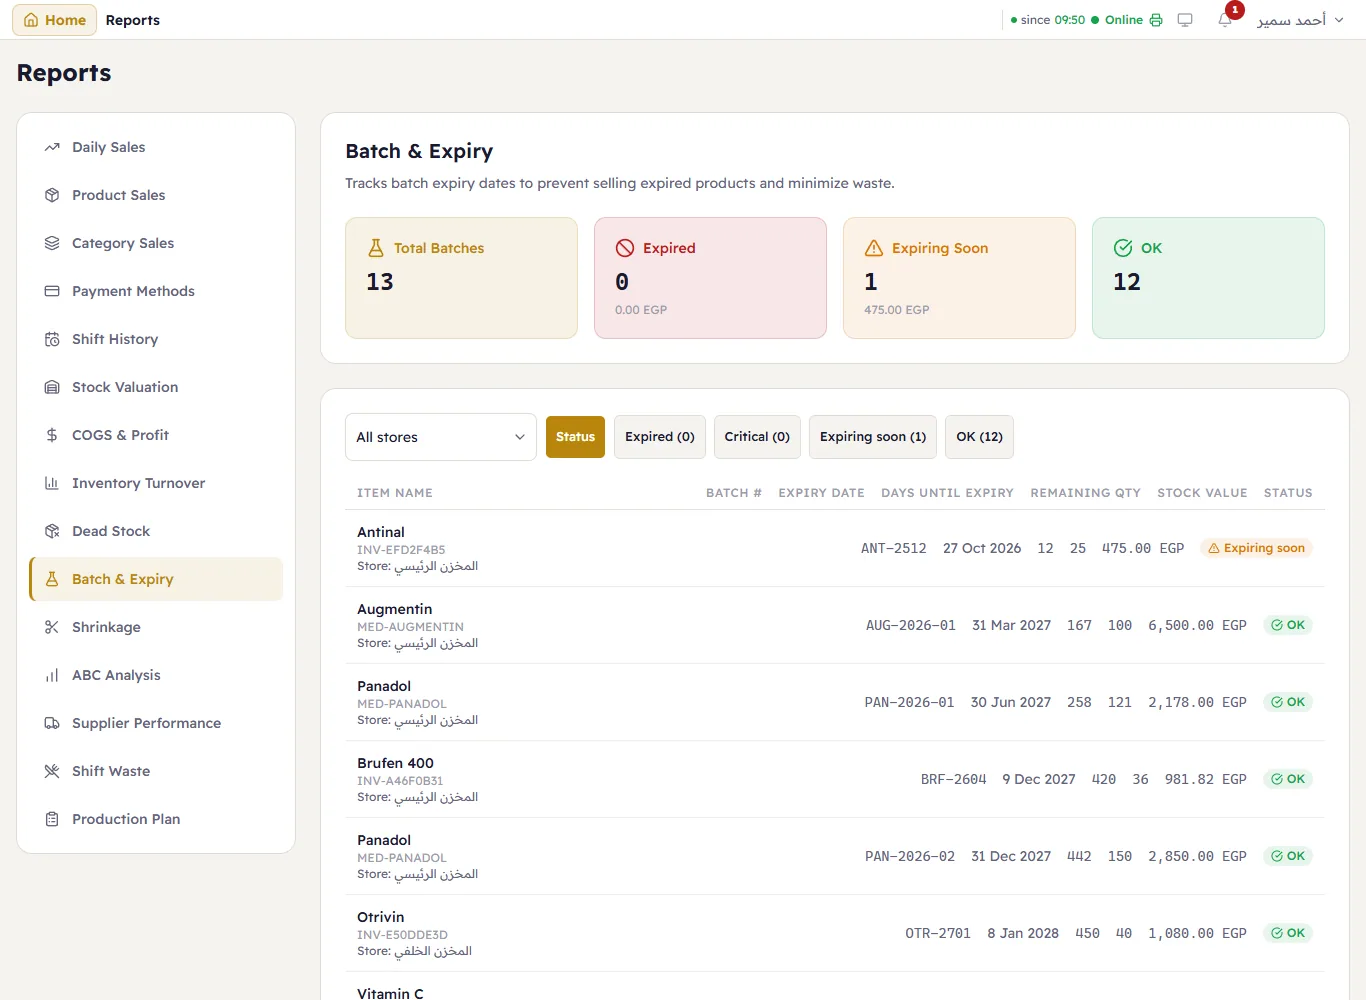
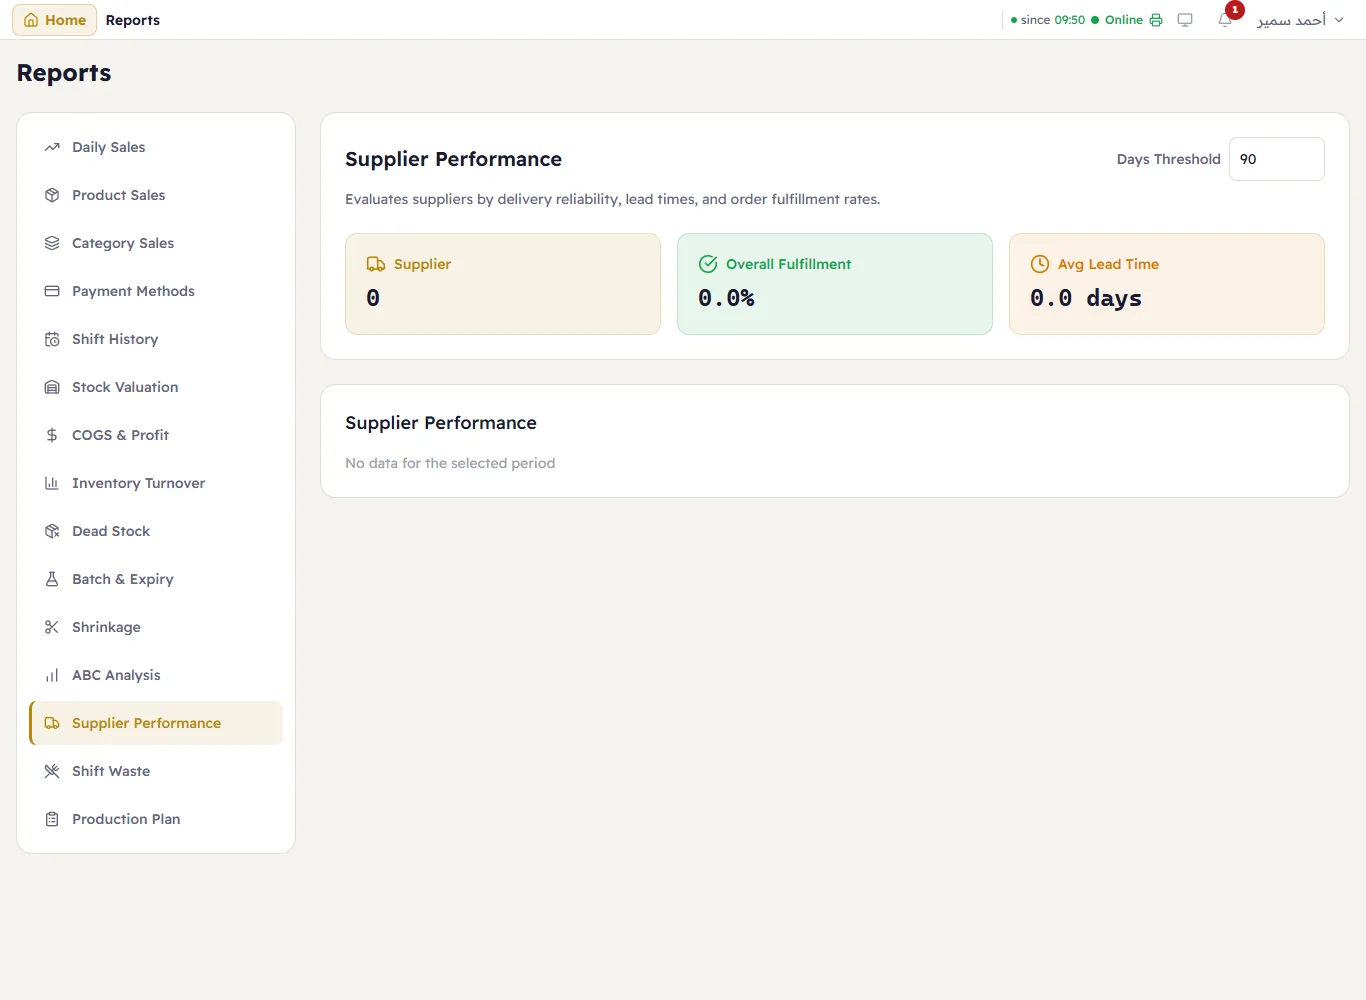
Supplier Performance is built from purchase orders — a shop that buys only with invoices sees no data there.